The spatial display of non-spatial or improperly represented Lyme disease data is endangering patients and misleading doctors, with life-altering, expensive, debilitating, and potentially fatal consequences. This is especially true in regions (such as the Northern Rockies) where detection effort is reduced by the very biases and presuppositions most of these maps create.
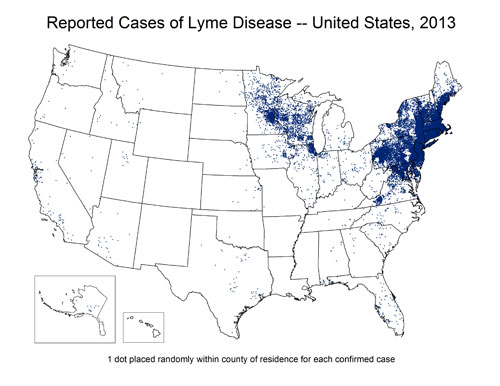
CDC Lyme Surveillance Maps do not represent where cases are contracted but are used and/or interpreted as depicting the geographic distribution of the illness. The act of placing the dots on a map implies a geographic relationship with the information being displayed….if the relationship intended is supposed to be diagnosis locations only (which these dots currently represent), this should be the title of the map, rather than a fairly minor foot note.
Detection effort and bias
These maps most commonly also do not depict relative surveillance and detection effort, which means they are very likely to imply a lack of disease where the real issue is lack of data (from lack of looking). This is a basic tenet of study design for any effort that is related to spatial data. Dots on a map that do not illustrate how the dots were searched for can be dangerously misleading and can imply relationships and patterns that do not exist. In many, many cases, a lack of occurrence points is most likely indicative of a lack of detection effort. These areas should be represented in a manner that makes it very clear that detection effort was lower or absent in those areas.
 These maps increase bias and decrease the odds of detection, because both doctors and patients (as well as health agencies) presuppose Lyme disease is absent in their area and therefore do not look hard enough to find it. Statements such as the following from a group of infectious disease doctors lead doctors away from detecting Lyme disease in areas that lack ‘dots’ so far on surveillance maps, and sadly are mirrored in guidelines and policies, further steering states away from adequate detection of locally acquired cases (which exist in the area noted below, though not reflected in surveillance records for those years):
Fortunately for Montana, there is no evidence of endemic Lyme disease or Lyme-related ticks in our state. From 2003-2012, only 49 cases of Lyme disease were reported in Montana and all of the confirmed cases occurred in persons with a history of travel to areas with endemic Lyme disease. It is essential when seeking care for a potential tick-borne ailment that you and your physician are aware that Lyme disease is not known to occur in Montana.
Similarly, current guidelines do not provide for sufficient testing effort or prophylactic treatment to protect patients, meaning additional diligence is needed, rather than less. Yet the same doctors responsible for the above statement submitted the opposite logic when Lyme legislation was proposed in Montana a few years ago.
Research has shown decreased prevention measures occur in areas such as the Northern Rockies, with one study even having illustrated this point specifically for the state of Montana as compared to states with higher perceived risk (Herrington, et al., 1997). It is noted in many sources throughout the literature that geographic biases and detection effort vary widely, which would also be expected to negatively influence symptom recognition and overall detection in areas where geographic preconceptions decrease careful consideration of Lyme.
What do these maps tell us?
As stated in the footnotes typically included at the bottom of the CDC’s surveillance maps, points indicate where patients are diagnosed, rather than where they contracted the illness. So the surveillance maps appear to show a lack of Lyme disease in certain areas, but actually do not indicate this, because they do not show the location of contraction (and also do not show relative detection effort by area). The maps do not result in an illustration of distribution, prevalence, or presence versus absence of Lyme disease (but imply all of the above by being placed on a map). In some locations, particularly where data or rates are displayed in tables, the disclaimers are displayed via link before the table, which far better than a footnote, and leads to clearer explanations than I recall seeing previously or frequently:
Background
Lyme disease has been a nationally notifiable condition in the United States since 1991. Reports of Lyme disease are collected and verified by state and local health departments in accordance with their legal mandate and surveillance practices. After removal of personal identifiers, selected information on cases is shared with CDC through the National Notifiable Diseases Surveillance System (NNDSS). Policies regarding case definitions, reporting, confidentiality, and data release are determined by states and territories under the auspices of the Council of State and Territorial Epidemiologists (CSTE). Surveillance data have a number of limitations that need to be considered in the analysis, interpretation, and reporting of results. Additionally, answers to frequently asked questions related to surveillance are available.
Limitations of surveillance data
- Under-reporting and misclassification are features common to all surveillance systems. Not every case of Lyme disease is reported to CDC, and some cases that are reported may be due to another cause. Under-reporting is more likely to occur in highly endemic areas, whereas over-reporting is more likely to occur in non-endemic areas.
- Surveillance data are subject to each state’s abilities to capture and classify cases, which are dependent upon budget and personnel and varies not only between states, but also from year to year within a given state. Consequently, a sudden or marked change in reported cases does not necessarily represent a true change in disease incidence, and should not be construed as such without knowledge of that state’s historical surveillance practices.
- Surveillance data are captured by county of residence, not county of exposure.
- States may close their annual surveillance dataset at a different time than CDC. Thus, the final case counts published by CDC may not exactly match numbers published by each state agency for a given year.
- Following its implementation in 1991, the national surveillance case definition for Lyme disease was modified in 1996 and again in 2008. Changes were generally minor but may have had some impact on surveillance and must be considered when attempting to interpret trends. Case definitions for each period are available.
Although a significant improvement over one line footnotes, these disclaimers are not always readily find-able or shared when maps are displayed. I would also argue that if clicking a link is required, they are not foremost in a viewers mind, and somewhat negated by the visual impact of what a map seems to be displaying (as described above). Furthermore, the manner in which this problem is alluded to on the maps or in some of the related tables creates further bias by implying that points in areas containing fewer points probably came from other areas (which may or may not be true, and in many areas is not true, which would be identified through further verification of existing positive cases). More recent footnotes are a vast improvement but still problematic:
Though Lyme disease cases have been reported in nearly every state, cases are reported from the infected person’s county of residence, not the place where they were infected.
Absence of proof is not proof of absense
If dots are absent in a given area, the disease is presumed absent, even in the absence of equitable detection effort or even an attempt at displaying or representing (or even evaluating) relative detection effort. If points are present, they are assumed to have come from somewhere else. With no mention of how many dots in other locations may have resulted from contractions in these few-to-no-dot areas (stories….recent).
 It seems that to have a map of diagnosis locations but no map of contraction locations is a very dangerous and misleading decision. Which brings us back to the idea of displaying non-spatial data spatially. Perhaps a map is not the right tool for the job.
It seems to me that if this were a trick question on a pop quiz, with the student having to identify the best way to convey data, the CDC would fail for:
- Using a map to display data that is not correlated with location (implying a representation of occurrence, prevalence, and distribution that misleads the audience)
- Using a map to display data without any representation of survey or detection effort (implying a representation of presence, absence, and relative abundance which is not actually available from the information at hand)
If a graduate student proposed a study that included the CDC’s end result map without any representation or discussion of detection effort (as displayed to the public often by the CDC), the student would not pass the proposal phase of their project and would likely politely be asked to leave the institution, or at least to retake a basic study design course. Similarly, if a student in a different discipline began a project accepting the assumption that a disease or organism was absent based only on information identical to what is available through CDC data, they would not have a reasonable basis for that assumption. Nor do we currently from CDC surveillance data to determine presence/absence of Lyme on a geographic basis. Yet this is the data used to determine the geographic distribution of Lyme.
Geographic consequences
When patients and doctors see these maps, it is easy to read the map as indicating the distribution of Lyme. In truth, the data presented on the map may or may not indicate this, and would need to be accompanied by copious missing information to provide a reasonable basis for estimating distribution. These maps skip all of those steps and provide misleading and confusing portions of an incomplete raw data set that would make any statistics professor cringe.
 These maps, however, have become a long standing and accepted visual representation of the distribution of Lyme disease, rather than the visual representation of data gaps, geographic bias, and uneven detection effort that keep us from knowing the true distribution.
The pattern these maps imply are likely to hold some degree of weight, in that Lyme and certain tick species have been historically more abundant in some areas, and may still be. But we can’t say that based on current data, especially in the absence of all the important information these maps lack. The fact that they have not changed in keeping with known changes in geographic distributions of ticks and Lyme disease illustrates the enormous probability that biases and unequal detection effort are precluding adequate representation of the distribution of Lyme disease.
We skip over these issues in most discussions of prevalence of Lyme, but without considering the information we are looking at in the proper context, there is no point discussing prevalence at all. If we don’t overturn the damage done by the collective image these maps have given us, we will continue to accept guidelines that largely preclude diagnosis and treatment measures in low-dot-occurrence areas (even the less than adequate measures available elsewhere), continue to allow agencies to move forward without adequate detection effort and strategies, and continue to remain undiagnosed and untreated for years in if we live in or contract Lyme disease in these areas.
Additional factors
Unfortunately, this commentary only looks at the bias inherent in the mapping strategy itself, which alone leads to inhibiting bias. In reality, the problem is further confounded by a long list of other surveillance and diagnosis problems and the problematic influence of treatment guidelines.
Unfortunately for patients, the sheer number of moving parts to this problem (the problem of adequate detection, diagnosis, and treatment of Lyme disease) makes even describing the problem overwhelming. Additionally, it makes it harder for patients to be heard…..or to be diagnosed and treated.
